It appears the US and UK have more than a cultural attachment and heritage! Take a look at the evolution of their normalized NGDP and RGDP. The trends are essentially the same for both countries and it is hard to distinguish between them.
The next chart zooms in on the last 10 years for NGDP. Both countries appear to have very similar monetary policies, with both “suffering” a “Great Depression” of similar significance and both experiencing a very weak recovery!
The question that has baffled commentators: Why is the UK´s labor market so much more exuberant?
The chart shows the behavior of employment since their pre-crisis peak.
Elements of an explanation for the different employment behavior:
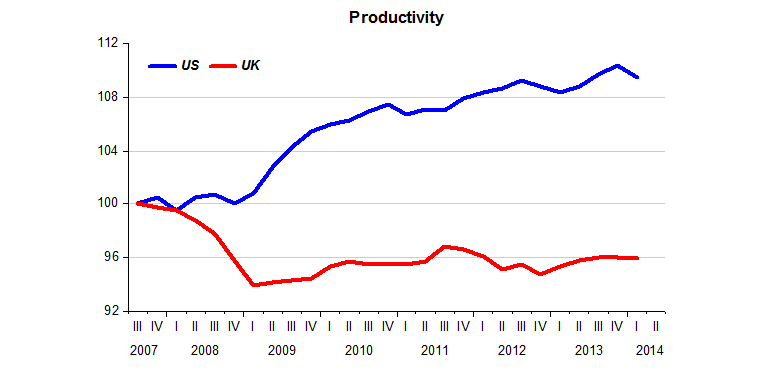
While the US experienced largely a negative demand shock (a shift to the left of the AD curve – a fall in the rate of growth of NGDP below the trend level growth rate), the UK experienced a mixture of negative AD and AS shocks. The negative AS shock in the UK is observed in the chart below which illustrates the behavior of productivity in the two countries.
Read the whole article here.


Be the first to comment on "US & UK: Siamese twins? Up to a point"